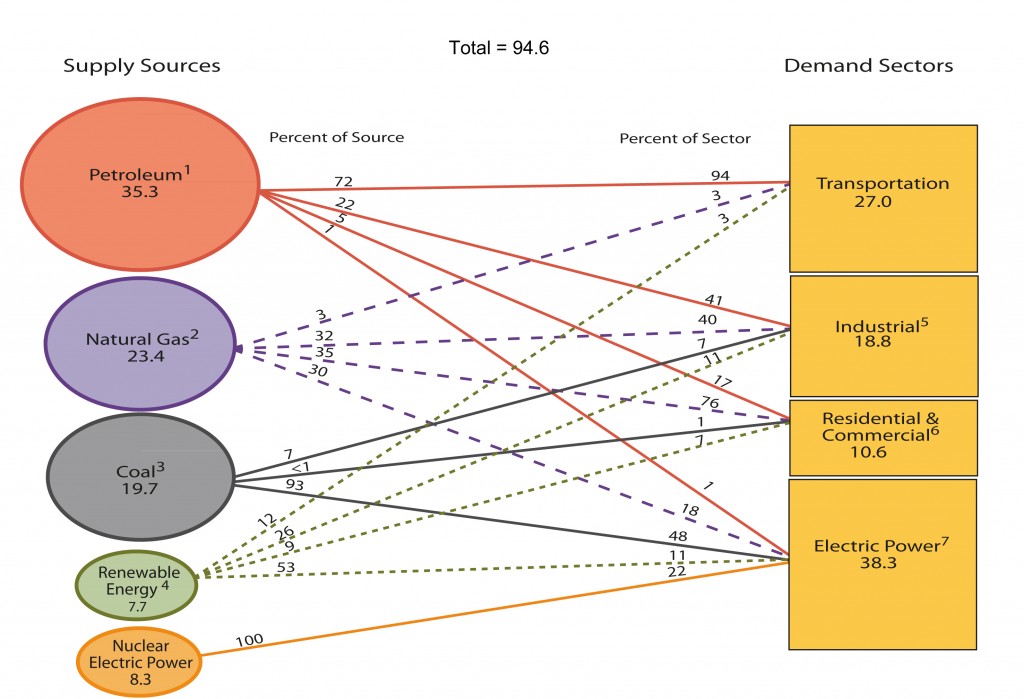
This is the primary energy flow by source and sector for the United States in 2009. There are caveats galore, but you get the picture (I guess it wasn’t as obvious as I had thought, so I have added):
The nuclear electric option provides about 22% of our utility power. Overall, nuclear provides only about 8.3% of our nation’s energy needs. This output from nuclear is not worth the hazards of nuclear. And when you compare the risks of new nuclear facilities to the risk of new renewables the only reasonable option is renewables. Renewables are redundant, nonpolluting, disperse, relatively cheaper to replace, and can be effective in baseload.
But, if the baseload issue concerns you, rather than nuclear, the better option is effective CO2 reduction from coal facilities. For those who do not know, the cost for removing the CO2 is in the $200-$300 million range–per coal powered generating facility.
For information on CO2 gas removal technology check out the Greehouse Gas Control Technologies Conferences .
Or the work being done in Germany by BASF.
The chart came from the US Energy Information Administration.

Sorry, the comment form is closed at this time.